How to Read Programming Error Messages
Maybe software-development used to be different. Maybe you spent hours devising algorithms, huddled together over whiteboards until your markers ran out and you were covered in sweat and dried-out coffee spots.
For most of us, that’s not quite the case anymore - most of modern software development consists of googling the right terms.
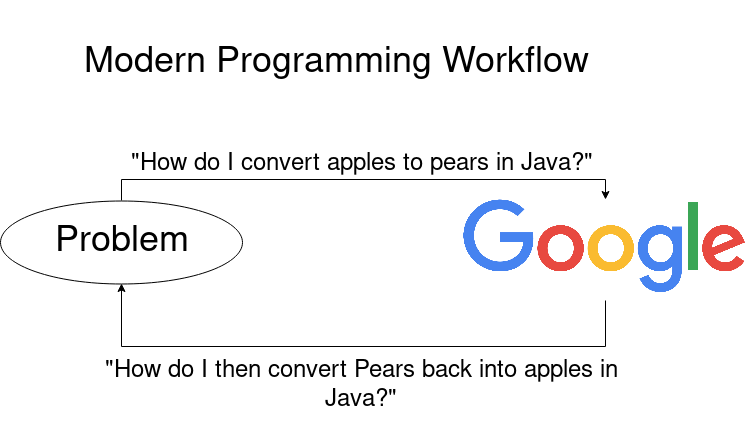 Modern programming workflow. Google a problem, find a solution. Google the next problem.
Surprisingly, figuring out what “the right terms” are can be pretty difficult. Especially if you’re new to programming or the technology you’re currently using.
This is the first in a series about how to google Error Messages. However to find the right search terms, we first need to understand just how to read an error message, and what parts are relevant. I’ll try to use different programming languages throughout, so we can see the differences and the similarities between them. Let’s dive in!
Anatomy of an Error Message
Error messages consist of two parts, the error message and the stack trace.
The error-message is “what’s wrong” - good error messages are helpful and tell you what you should do and bad error-messages sometimes look like something that could summon Cthulhu.
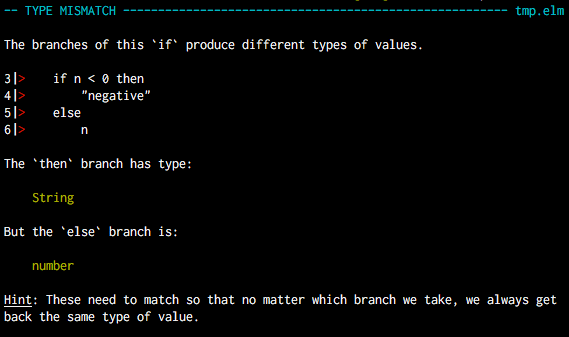 A wonderful error message from the Elm language
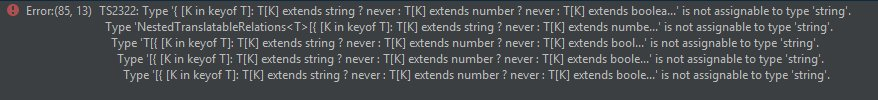 Undecipherable hieroglyphics, aka a bad Typescript error message.
The stack-trace on the other hand is “where it’s wrong.”
Note that stack-traces have different names in different languages, Python calls them tracebacks - the core concept is the same however.
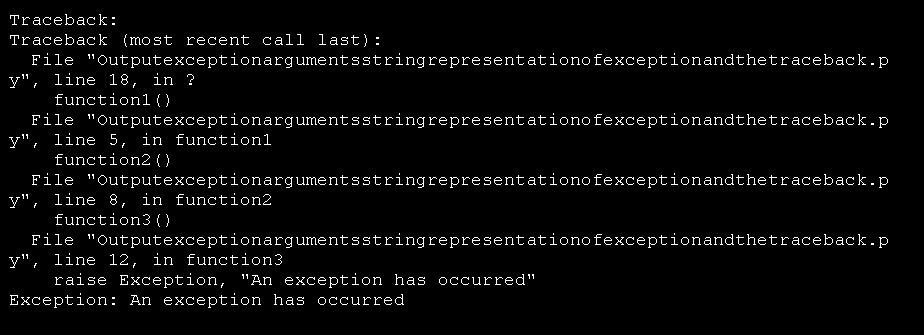 A stack trace, or a traceback as Python prefers to call it.
Now when googling what’s going wrong - you use the error message more often than the stack trace. The stack trace is useful as it tells us all kinds of contextual information - e.g. which line you’re making a mistake, or what library is throwing an error.
Anatomy of a Javascript Error Message
Let’s try to look at a very small Javascript program to see how we can use both the error message and the stack-trace.
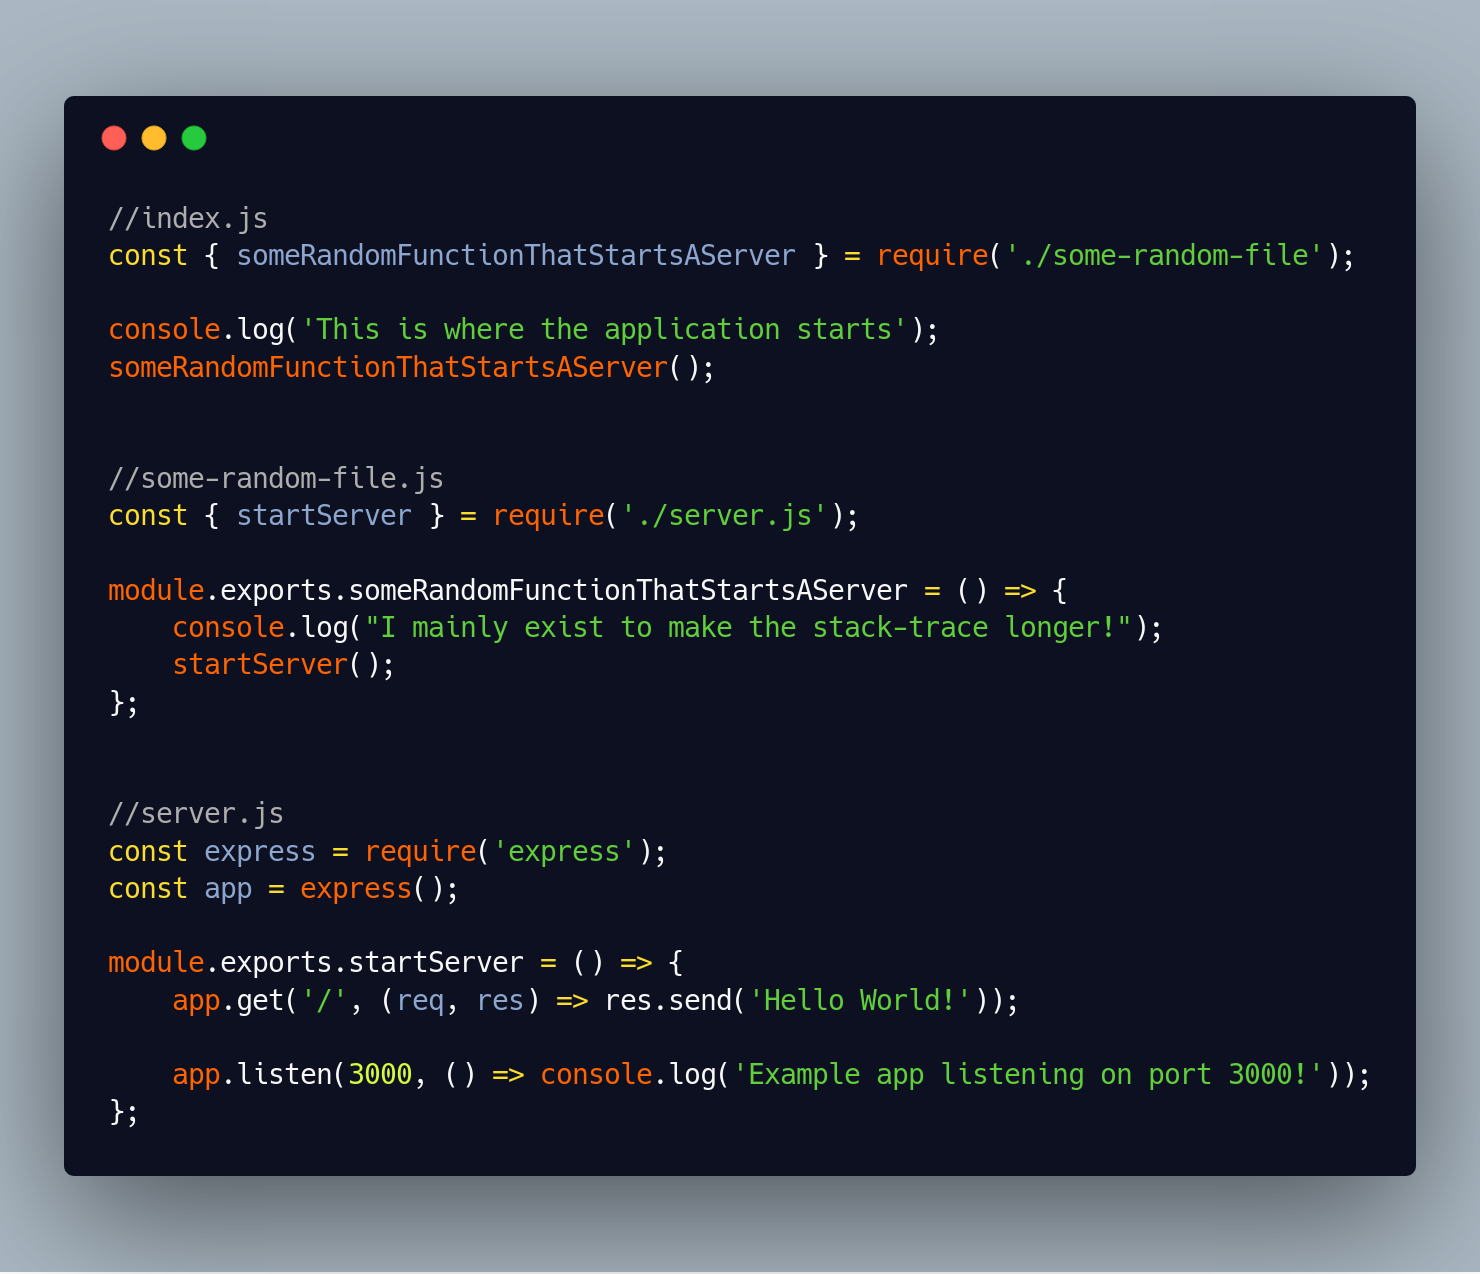
This is the reasonably simple program. It consists of three files. The first index.js is where the application starts, the next some-random-file.js doesn’t do much - it’s just there to make the stack-trace longer, and server.js starts an express server listening on port 3000.
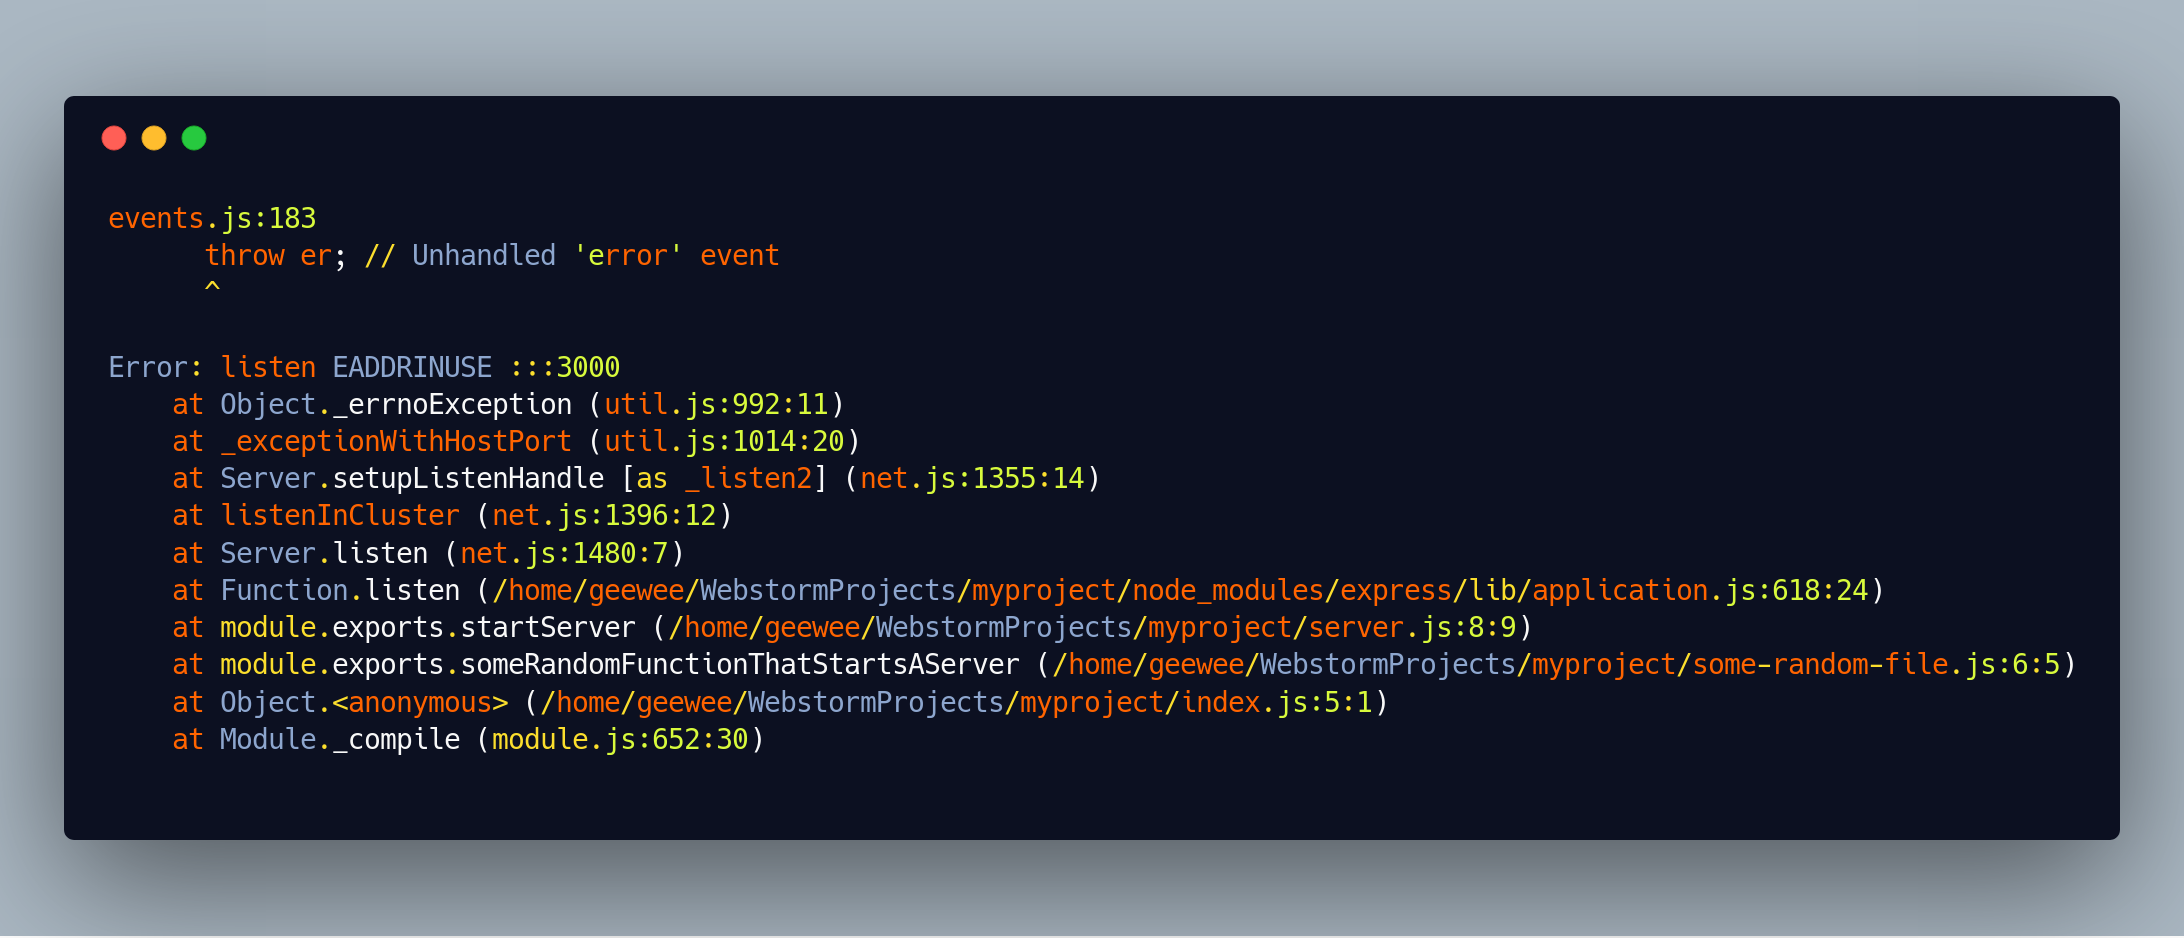
If we accidentally run this program twice at the same time, we’ll get an error - as the port is already taken. We’ll get the following error message and stack trace.
 EADDRINUSE? That's probably some sort of spell.
Stack-traces (often) go from the oldest entries in the bottom to the newest on the top. Let’s see if we can split this one into into several parts.
Startup-noise
These often happen when using frameworks. What they have in common, is that they’re usually runtime initialization logic, and most of the times they have nothing to do our actual error.
It can be hard to tell what’s startup-noise when starting out, but after having seen a few errors you usually learn to tune it out pretty quickly. A good rule of thumb is that anything between the first line of your code and the start of the stack trace is potentially startup-noise.
In this particular example, the first line is startup-noise.
Your code
This is the code you’ve written. You can usually tell what code is yours from the file names or paths. In this case we can see: "/home/geewee/WebstormProjects/myproject/index.js:5:1" which is the path to our index.js file.
There’s two parts of our code are a little more special than the others. The first line of your code is important, as the lines before it are often startup-noise.
The most important part however, is the last line of your code.
Last line of your code.
This is often where the magic happens. What you’re looking for is the last line of the stack trace that you wrote. This means the last line that’s not from the language runtime or libraries you’re using. It’s usually the most interesting line, as this is the last line where you could have made a mistake.
In this particular example, the last line of our code is:
"module.exports.startServer (/home/geewee/WebstormProjects/myproject/server.js:8:9)"
That means server.js line 8 is a good place to start looking for what we’re doing wrong.
Line after the last line of your code
This line is important, if it exists because it usually tells us what library or third party code the error happens in. In this case, the line is:
"Function.listen (/home/geewee/WebstormProjects/myproject/node_modules/express/lib/application.js:618:24)”
Worth noting here, is that the path is from our project directory into node_modules\express\.
Now node_modules/ is the directory where Javascript stores libraries. This means that the error is happening within the express library. This is useful because we want to know this when figuring out what we should search for later.
Internal third party calls
If the actual error happens in a third party library, there will often be some internal calls before the actual error is thrown. The internal third party calls are the lines between the last lines of your code and the actual error message. They sometimes give more context as to what exactly is going wrong, but often they’re not that important.
The actual error message:
The last important part is the actual error message. It’s not necessarily at the very top of the stack trace, but it’s usually pretty close. In this case it’s this part:
Error: listen EADDRINUSE :::3000
This is the part we’ll be using in our search queries. In this case the error message can roughly be translated to “Address 3000 in use” - but you would be excused for not knowing that. It’s not a very good error message.
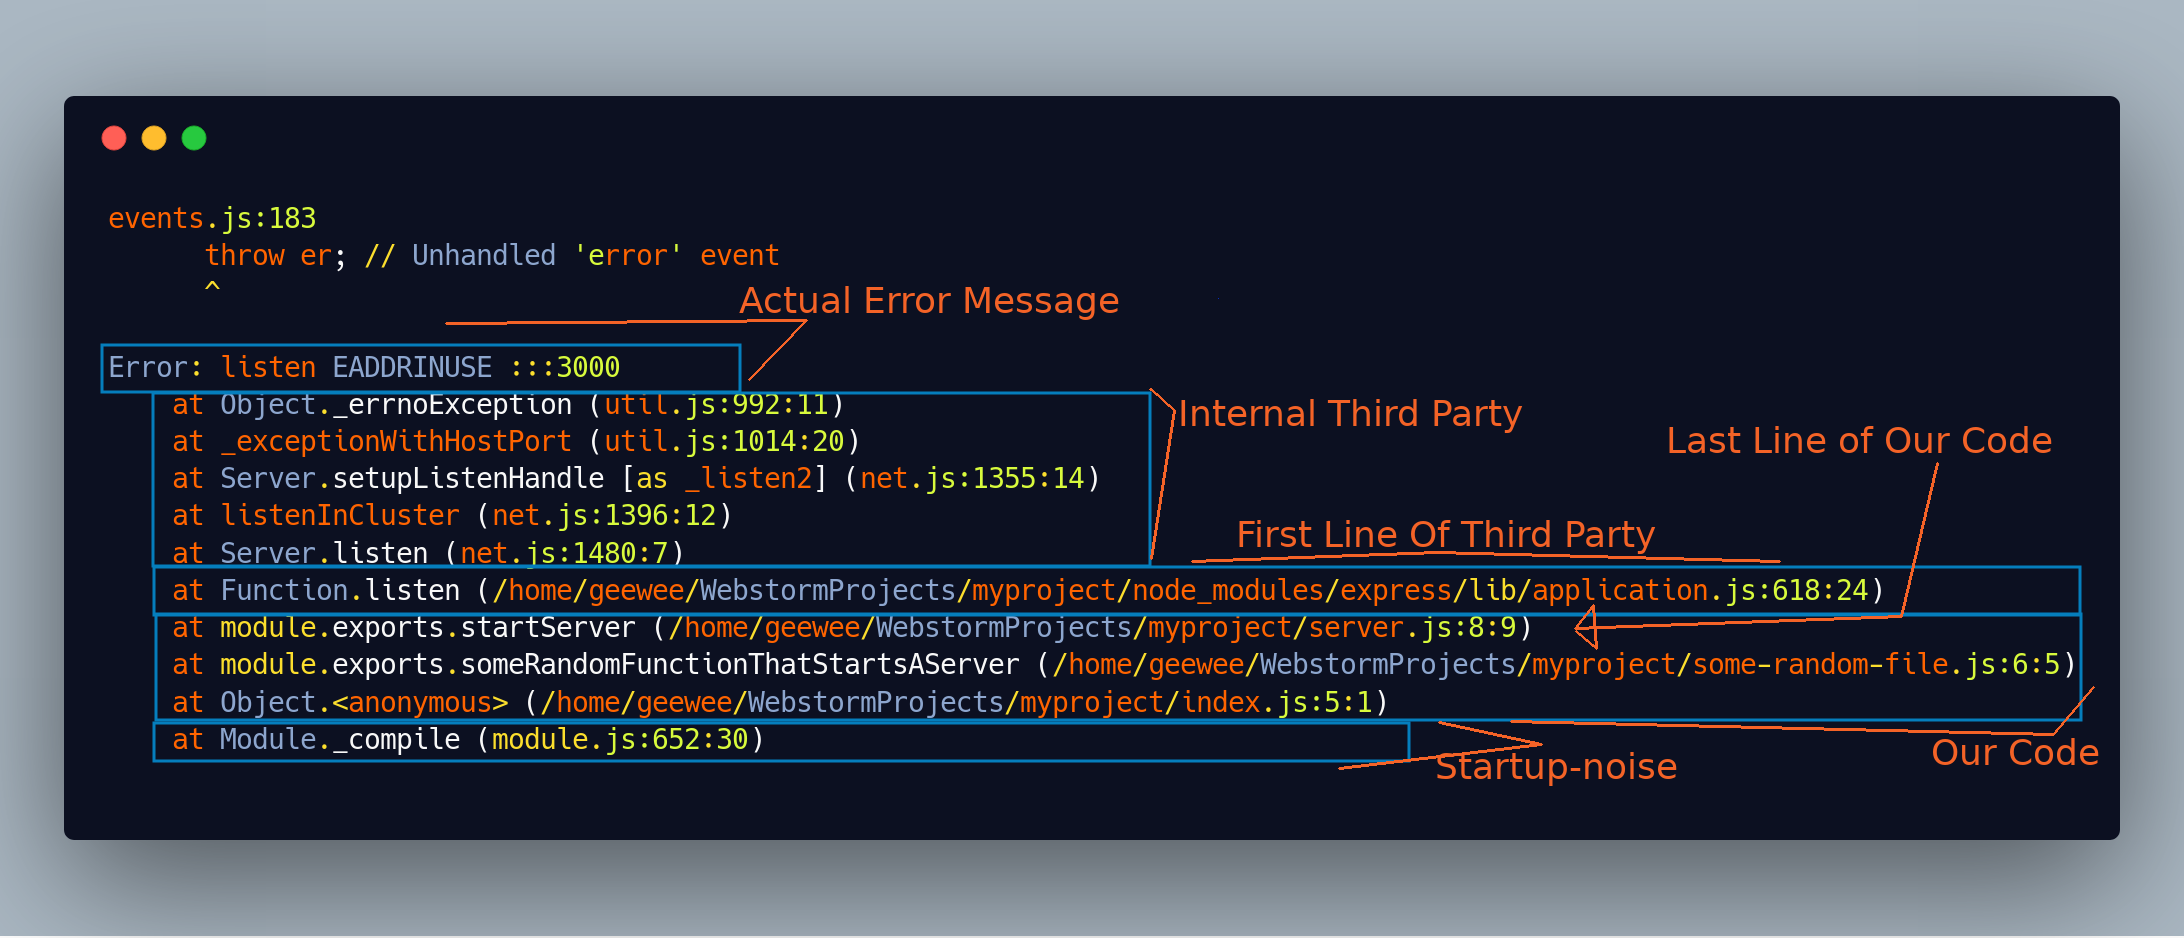
Looking at the entire error message again, with the different parts annotated, it looks like this:
Anatomy of a Python Error Message
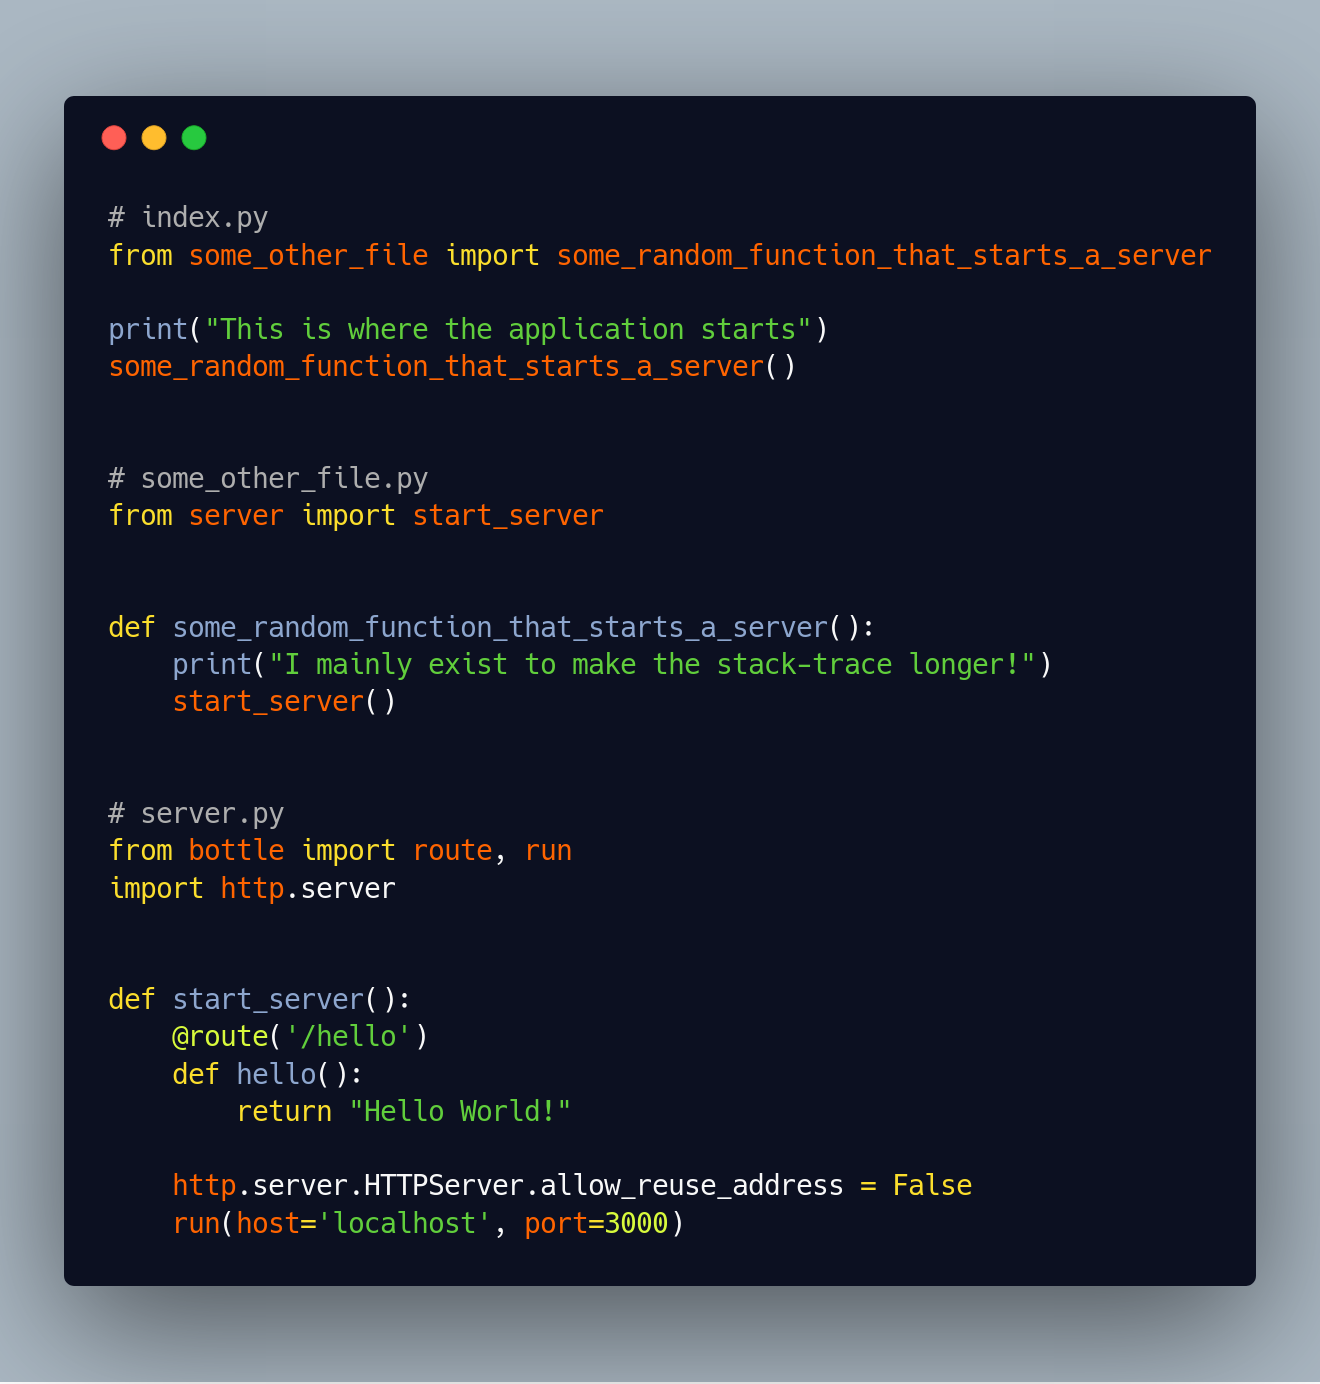
Let’s try to look at the same situation in Python, to see how stack-traces vary from language to language. This is mostly the same program as before with the same files. The only difference is, that it uses the Python framework called bottle instead of express to listen to port 3000.
Just as before, if we run multiple instances of the program, we get an error:
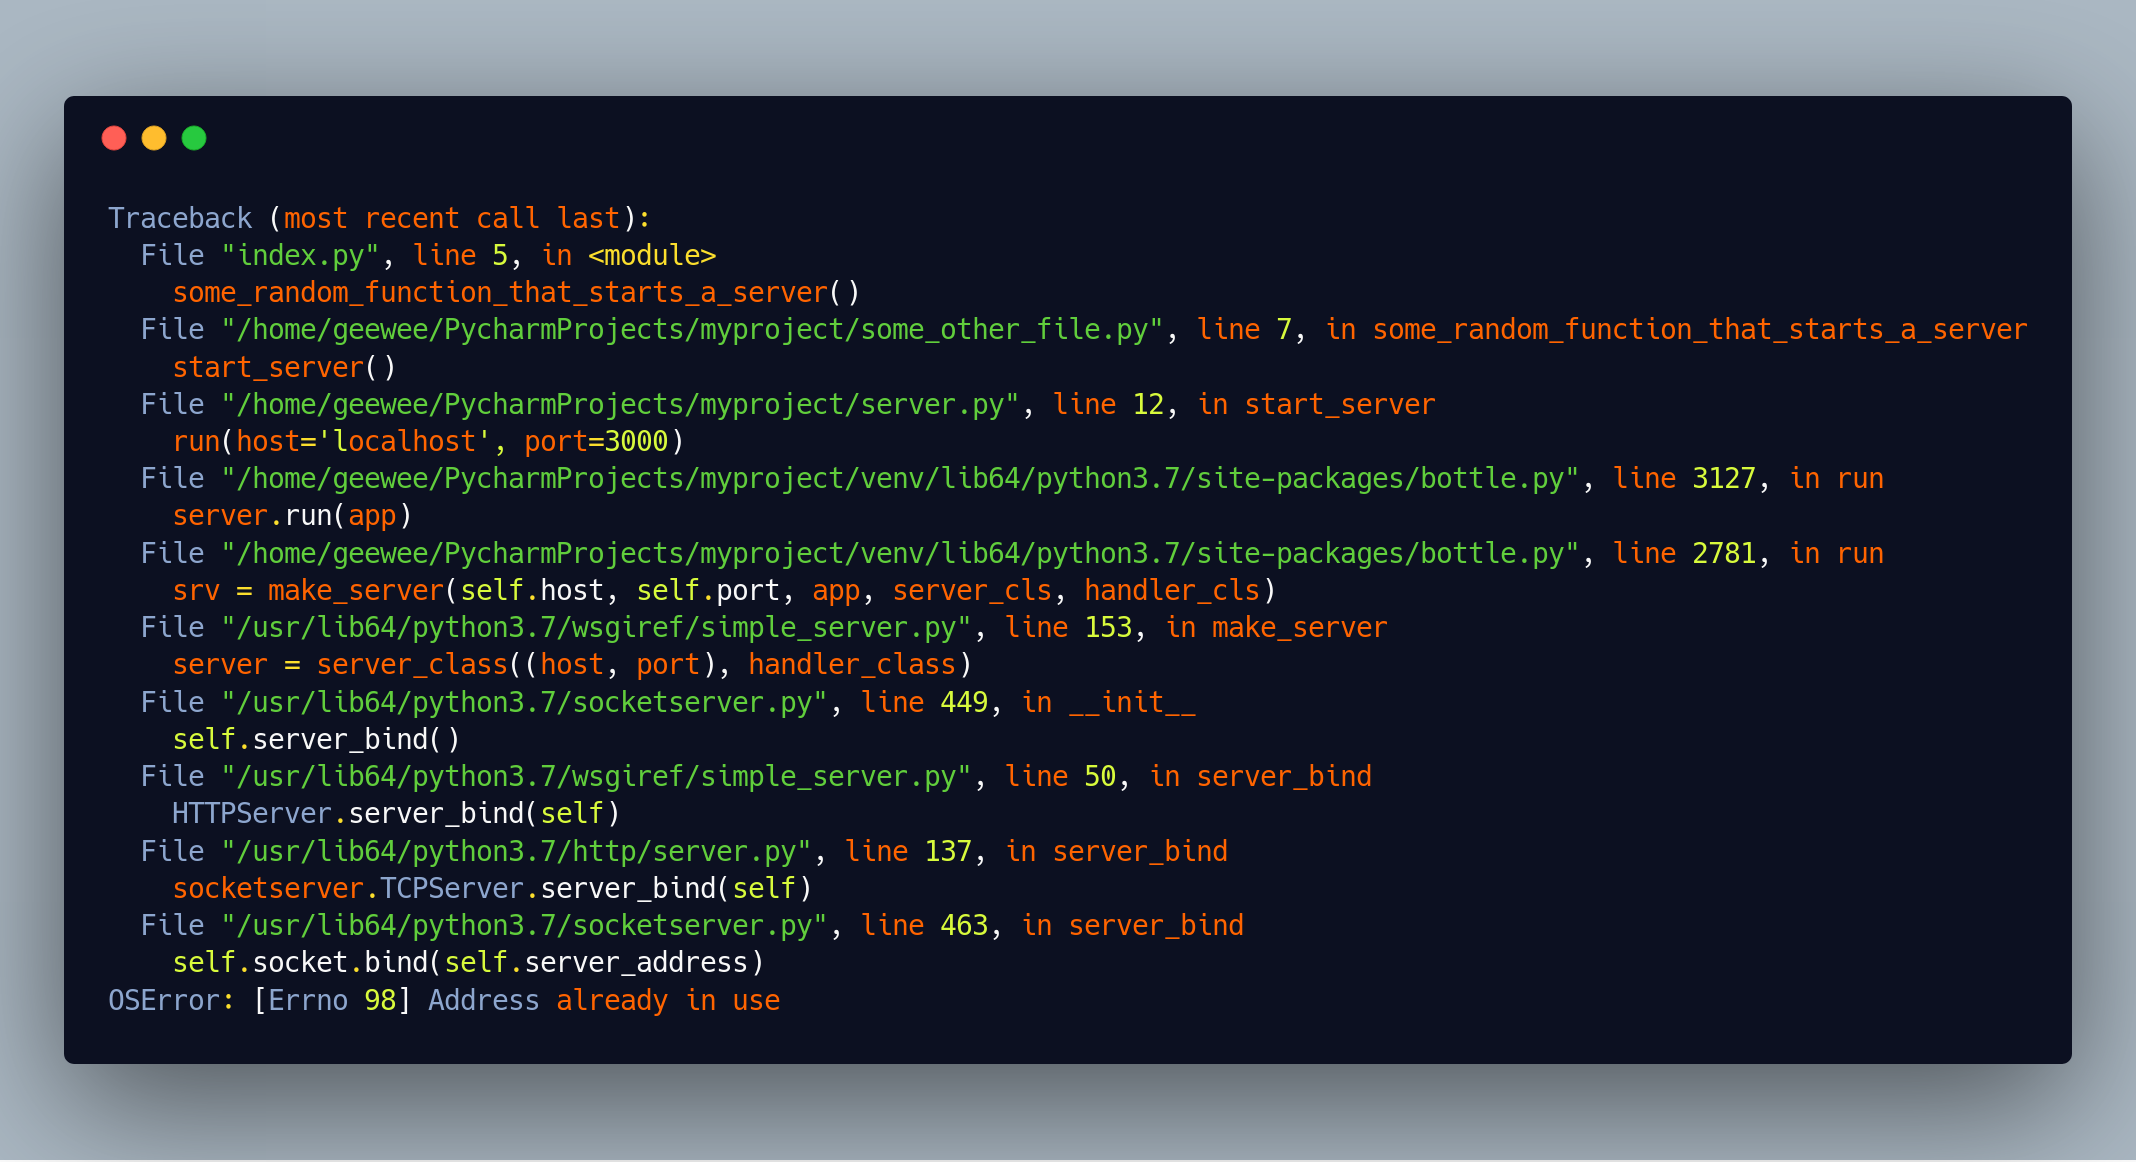
There’s a few notable differences to this stack-trace (which Python prefers to call a trace-back.)
The most obvious one is, that it’s in a different order.
In the Javascript example, the oldest calls were at the bottom, but as this python example helpfully points out, here the most recent calls are at the bottom instead.
There’s also no startup-noise, the stack-trace starts right at the line of our code where the error happens.
Apart from that, the rest of the parts are the same, let’s take a closer look.
There’s “our code” - both first and last line. The first line is also the first line of the stack trace:
File "index.py", line 5, in <module>
    some_random_function_that_starts_a_server()
and there’s the last line of our code:
File "/home/geewee/PycharmProjects/myproject/server.py", line 12, in start_server
	run(host='localhost', port=3000)
Then there’s the first line of the third-party code:
File "/home/geewee/PycharmProjects/myproject/venv/lib64/python3.7/site-packages/bottle.py", line 3127, in run
	server.run(app)
Worth noting here is that /site-packages/ is where python stores third-party libraries. So based on that directory we know the next call is to a third party library. Reading the directory name, bottle/ - we can guess that the error is coming from the bottle library.
Then there’s internal third party calls in the bottle library, and at the end, the actual error message:
"OSError: [Errno 98] Address already in use"
A little better than the one from express, but still not as good as it could have been.
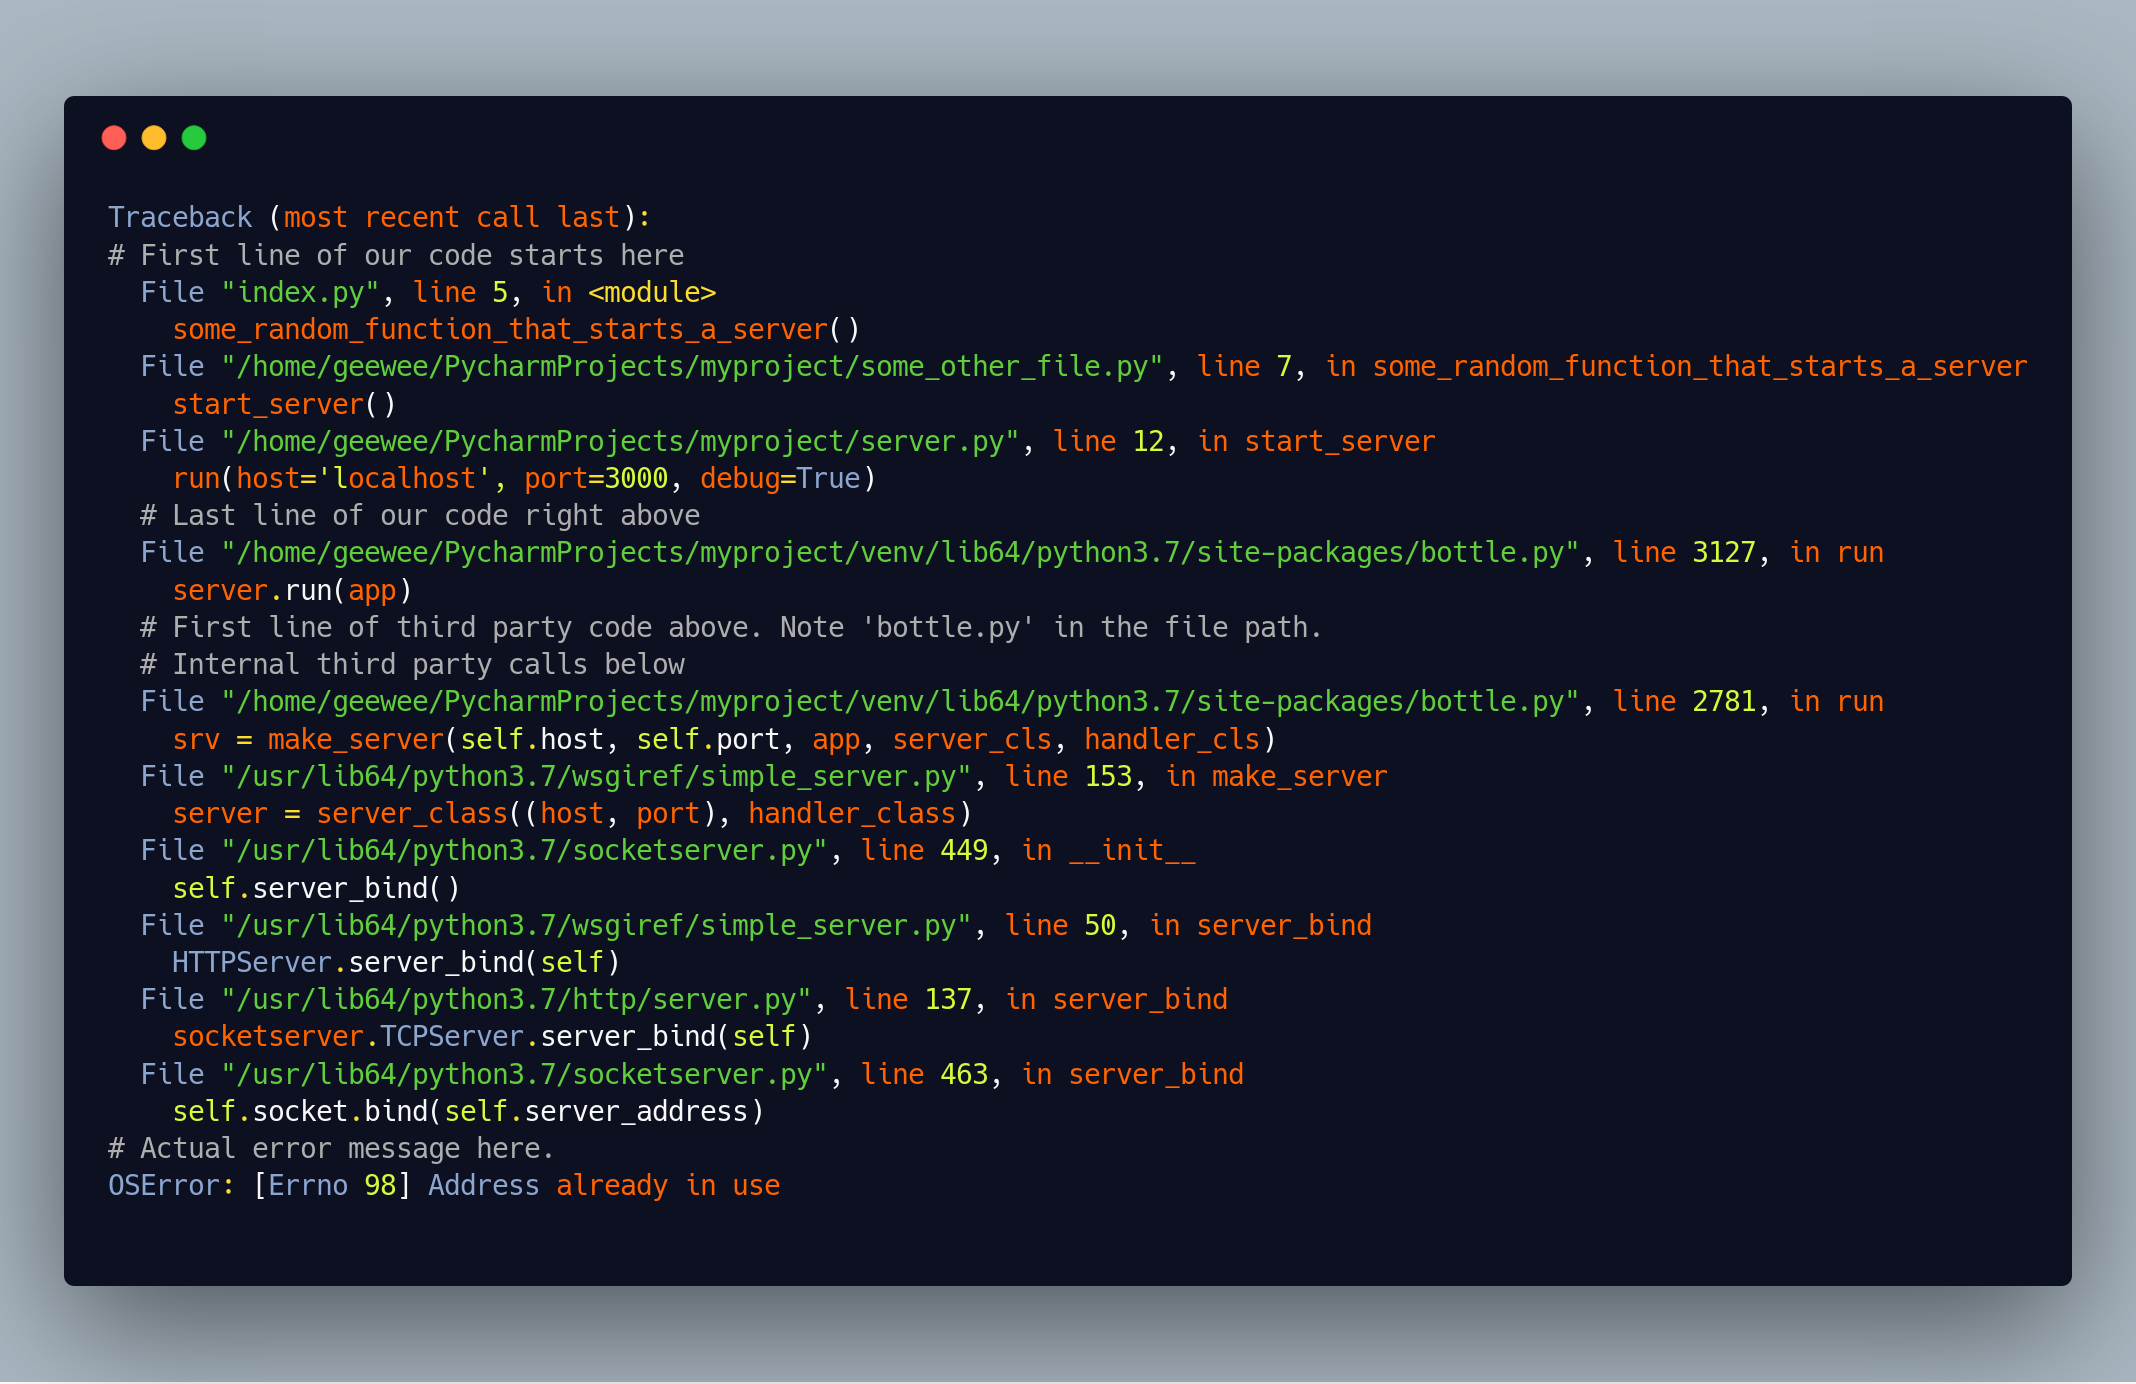
If we annotate the stack-trace with the different parts, it looks like this:
Fifty Shades of Stack Traces
Now, the two stack traces we’ve seen here are reasonably identical - there’s potentially some startup noise, some of our code and an error thrown in a third party library. Now not all error conditions are like that, so not all stack traces are like that either.
Third Parties Not Allowed
Sometimes there’s no third-party calls, as this Java example shows us:
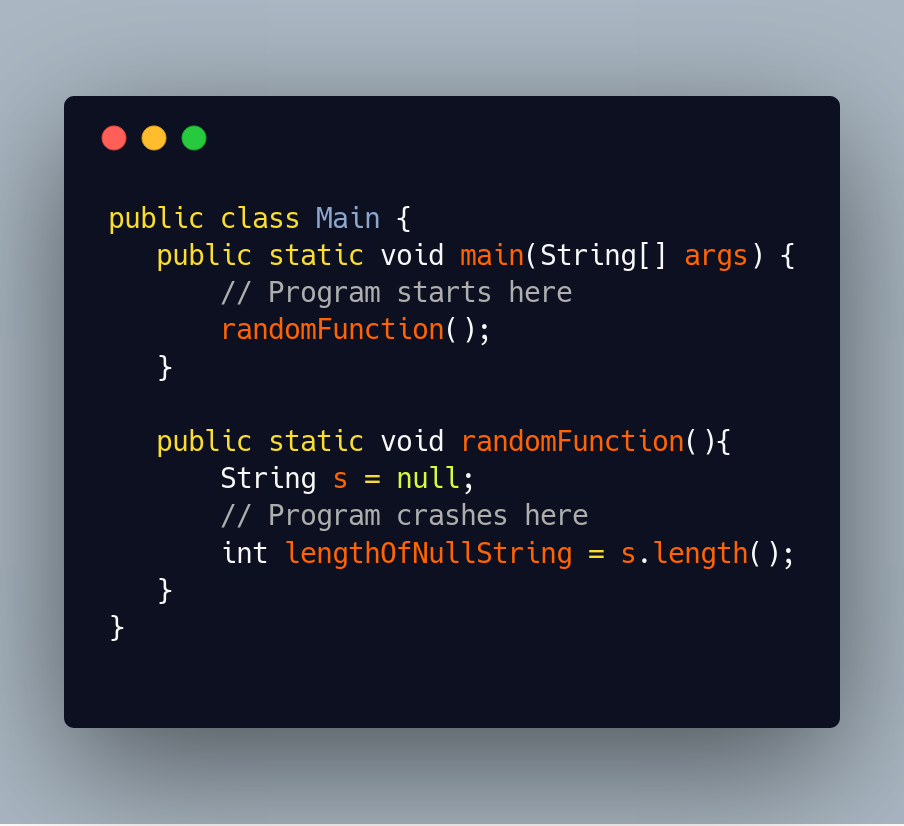
This program tries to figure out the length of a java String which has been assigned to null. Running this program gives us a very minimal stack-trace:
Exception in thread "main" java.lang.NullPointerException
    at Main.randomFunction(Main.java:9)
    at Main.main(Main.java:4)
Note there’s no startup-noise, no third party code. There’s only our code, ending at the exact line where we’ve made our mistake. If there’s no third-party code, the “last line of our code” is the place to check out to see what’s gone wrong.
Dude Where’s My Code?
Now let’s look at an example using a large framework called Spring Boot. Spring works with both Java and Kotlin. This example is in Kotlin. Now we’ll cause an error without ever really having our code appear in the stack trace. We can do this by defining a very small application with two classes that both want to listen to the same /hello HTTP endpoint. Spring can’t decide which class should handle the /hello endpoint, and thus crashes at startup time.
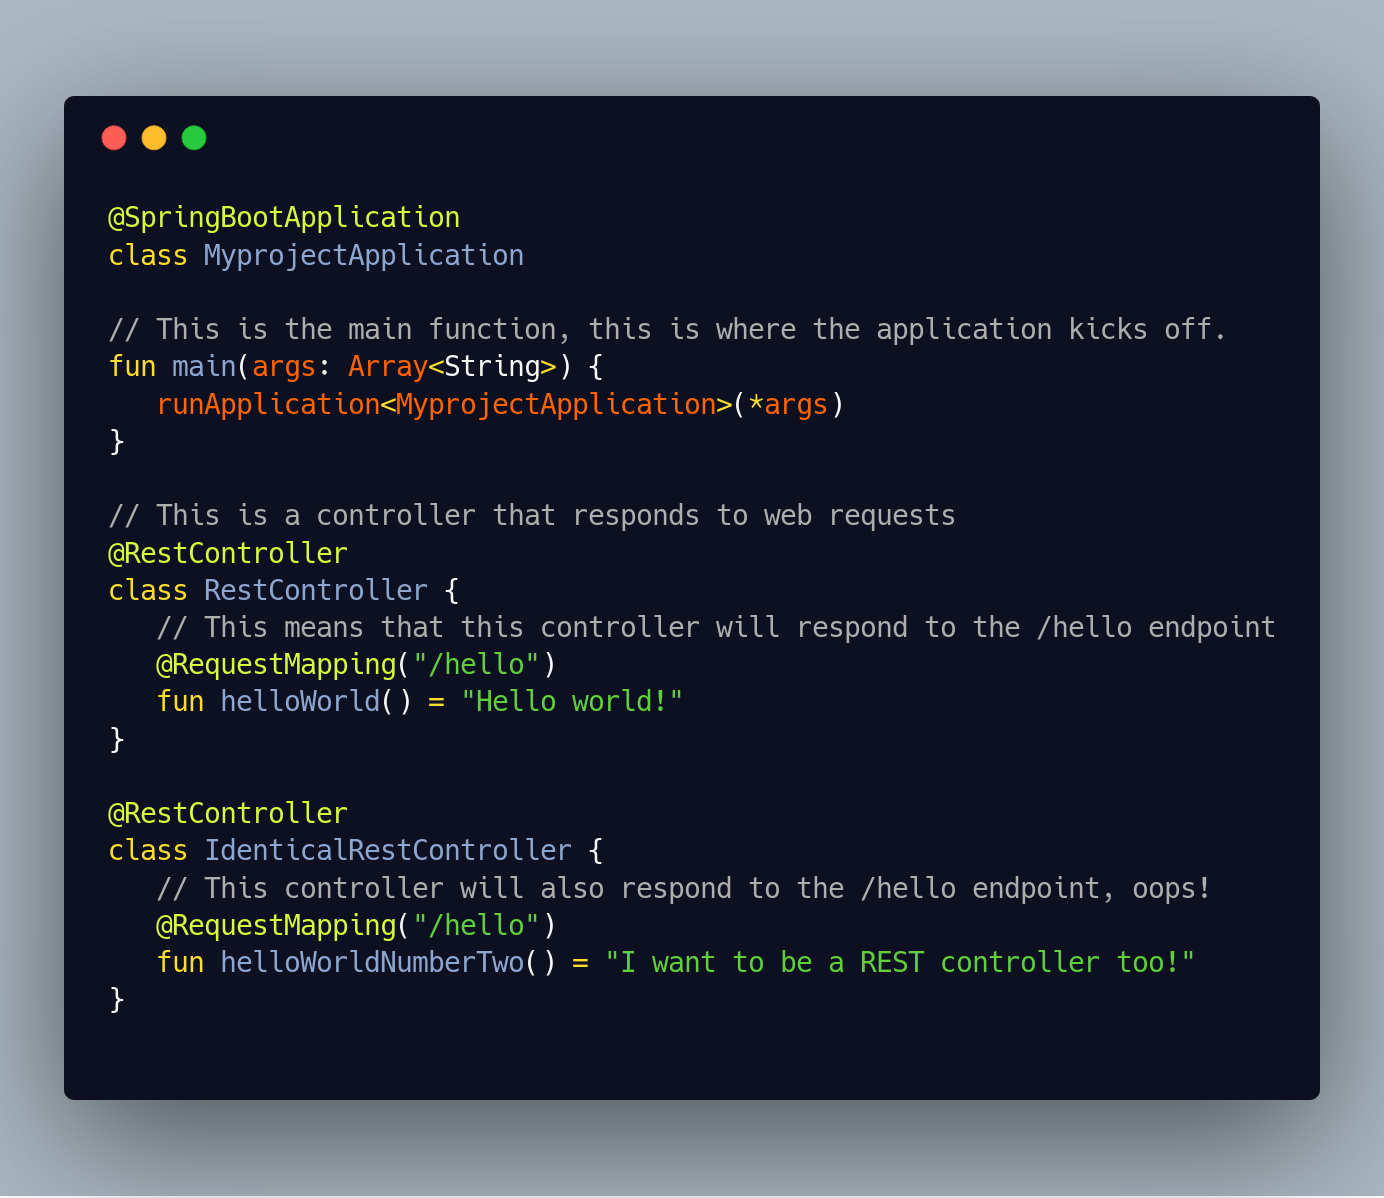
The stack-trace we’ll get is this behemoth:
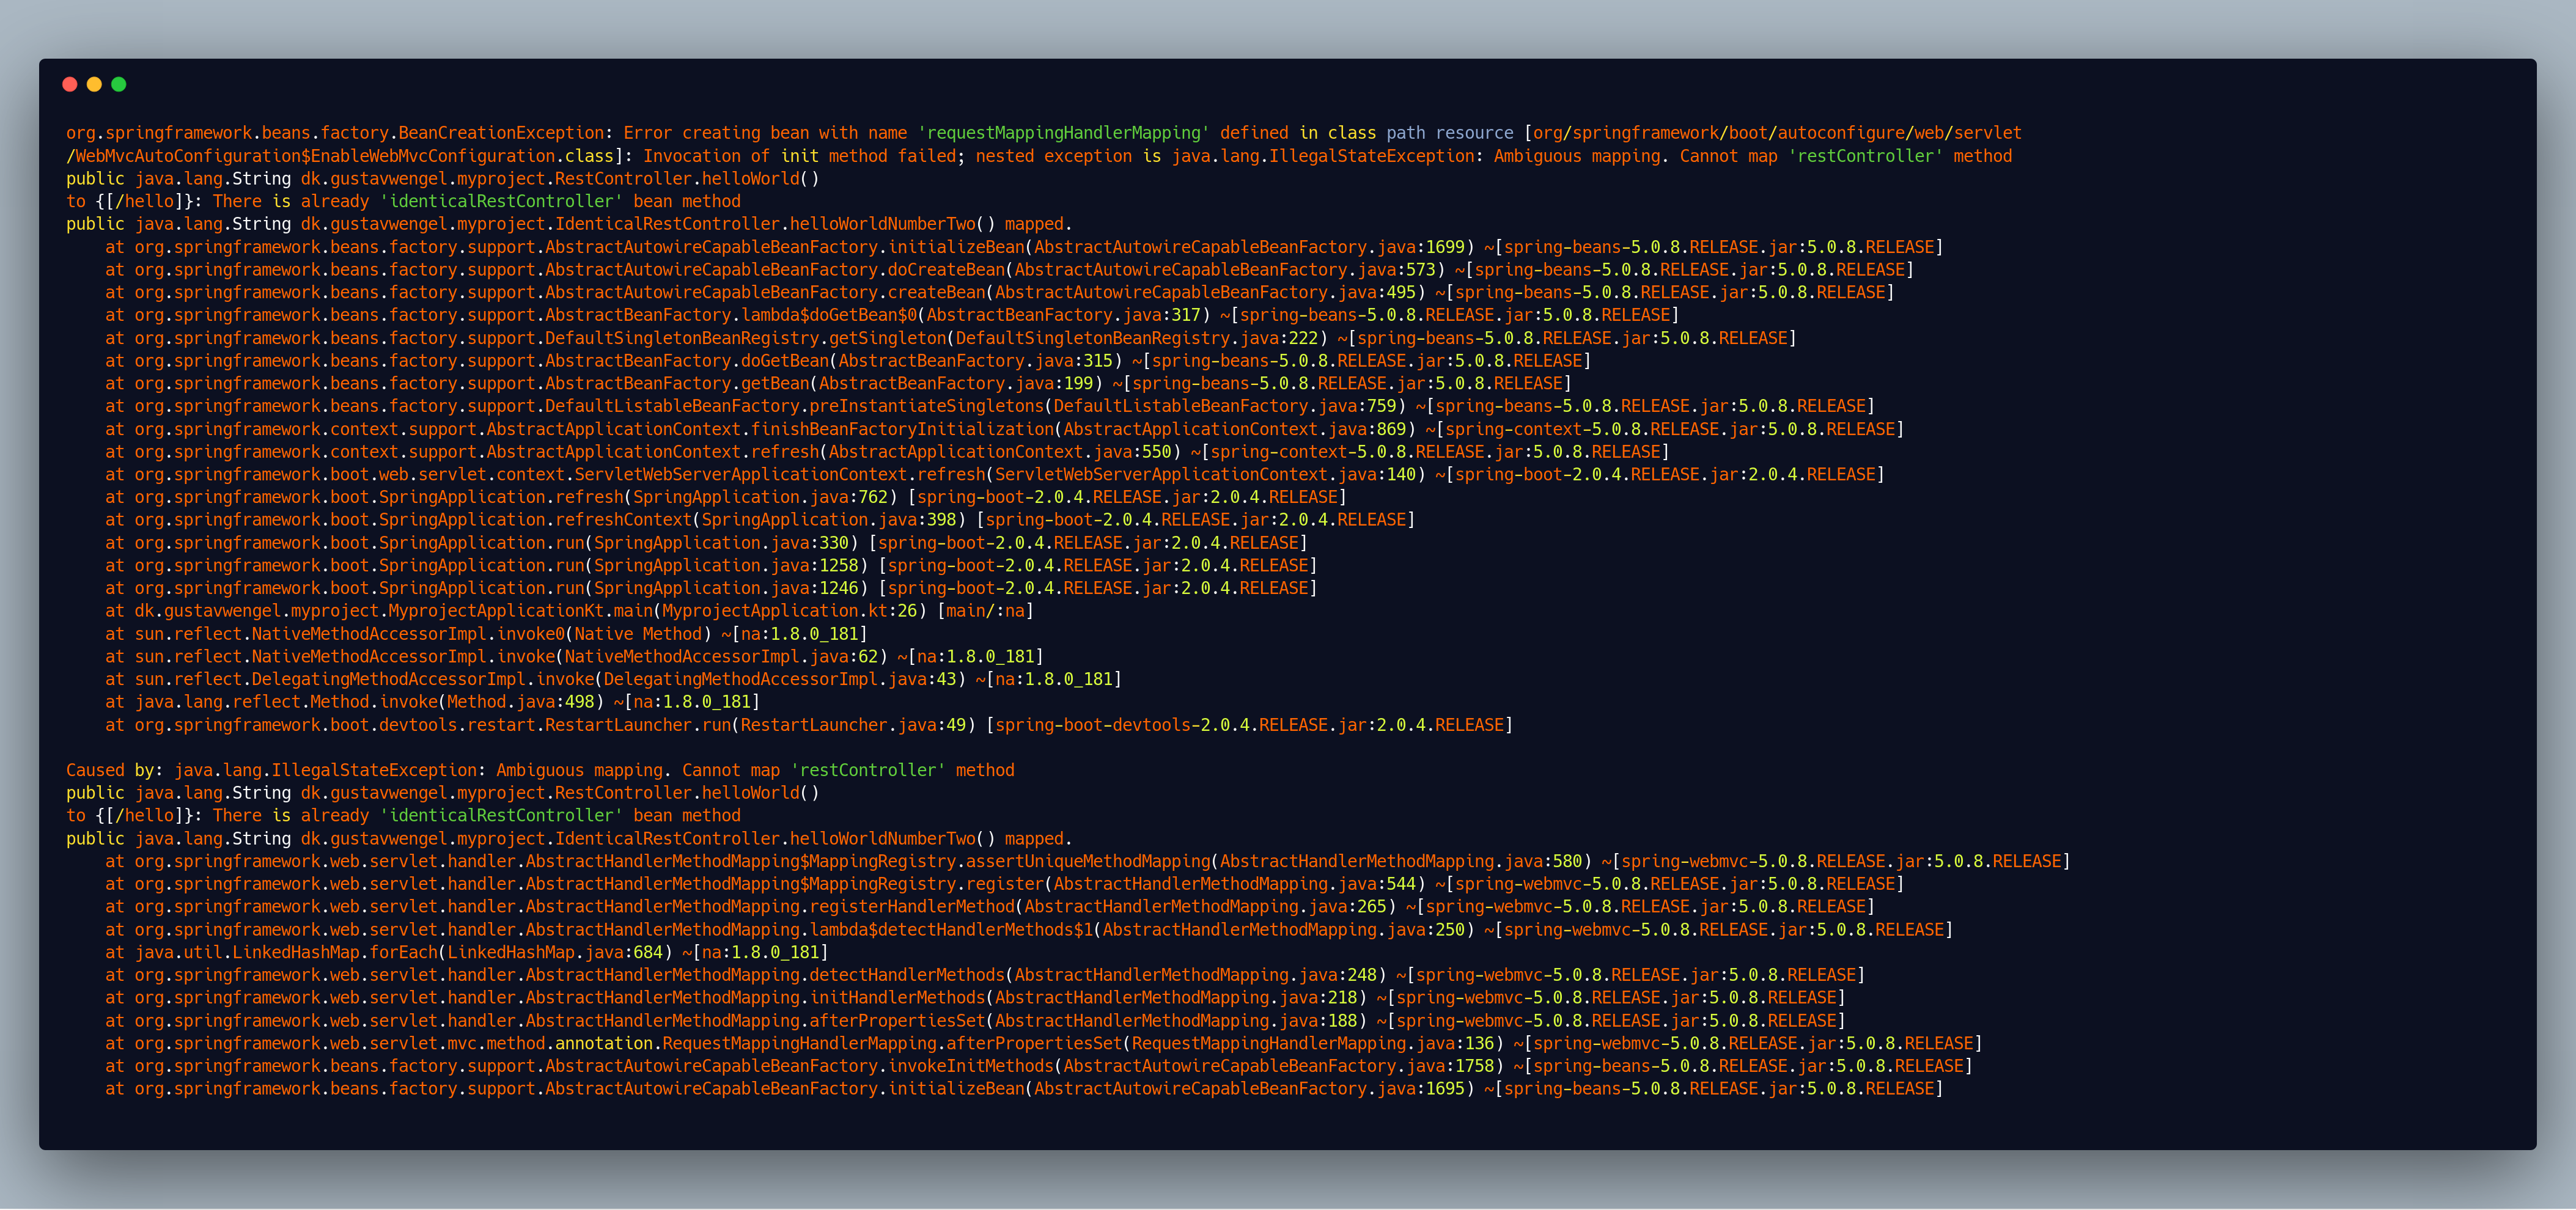 Straight out of the maws of hell
We’re not going to dissect this intensely, as it’s very large. Our main method is somewhere in it, but that method doesn’t really do much. The stack-trace is instead dominated primarily by internal third party calls from the Spring Framework. If we strip the internal third party calls and remove the last part, as that’s simply an inner Spring exception, and not that important - we get something more comprehensible.
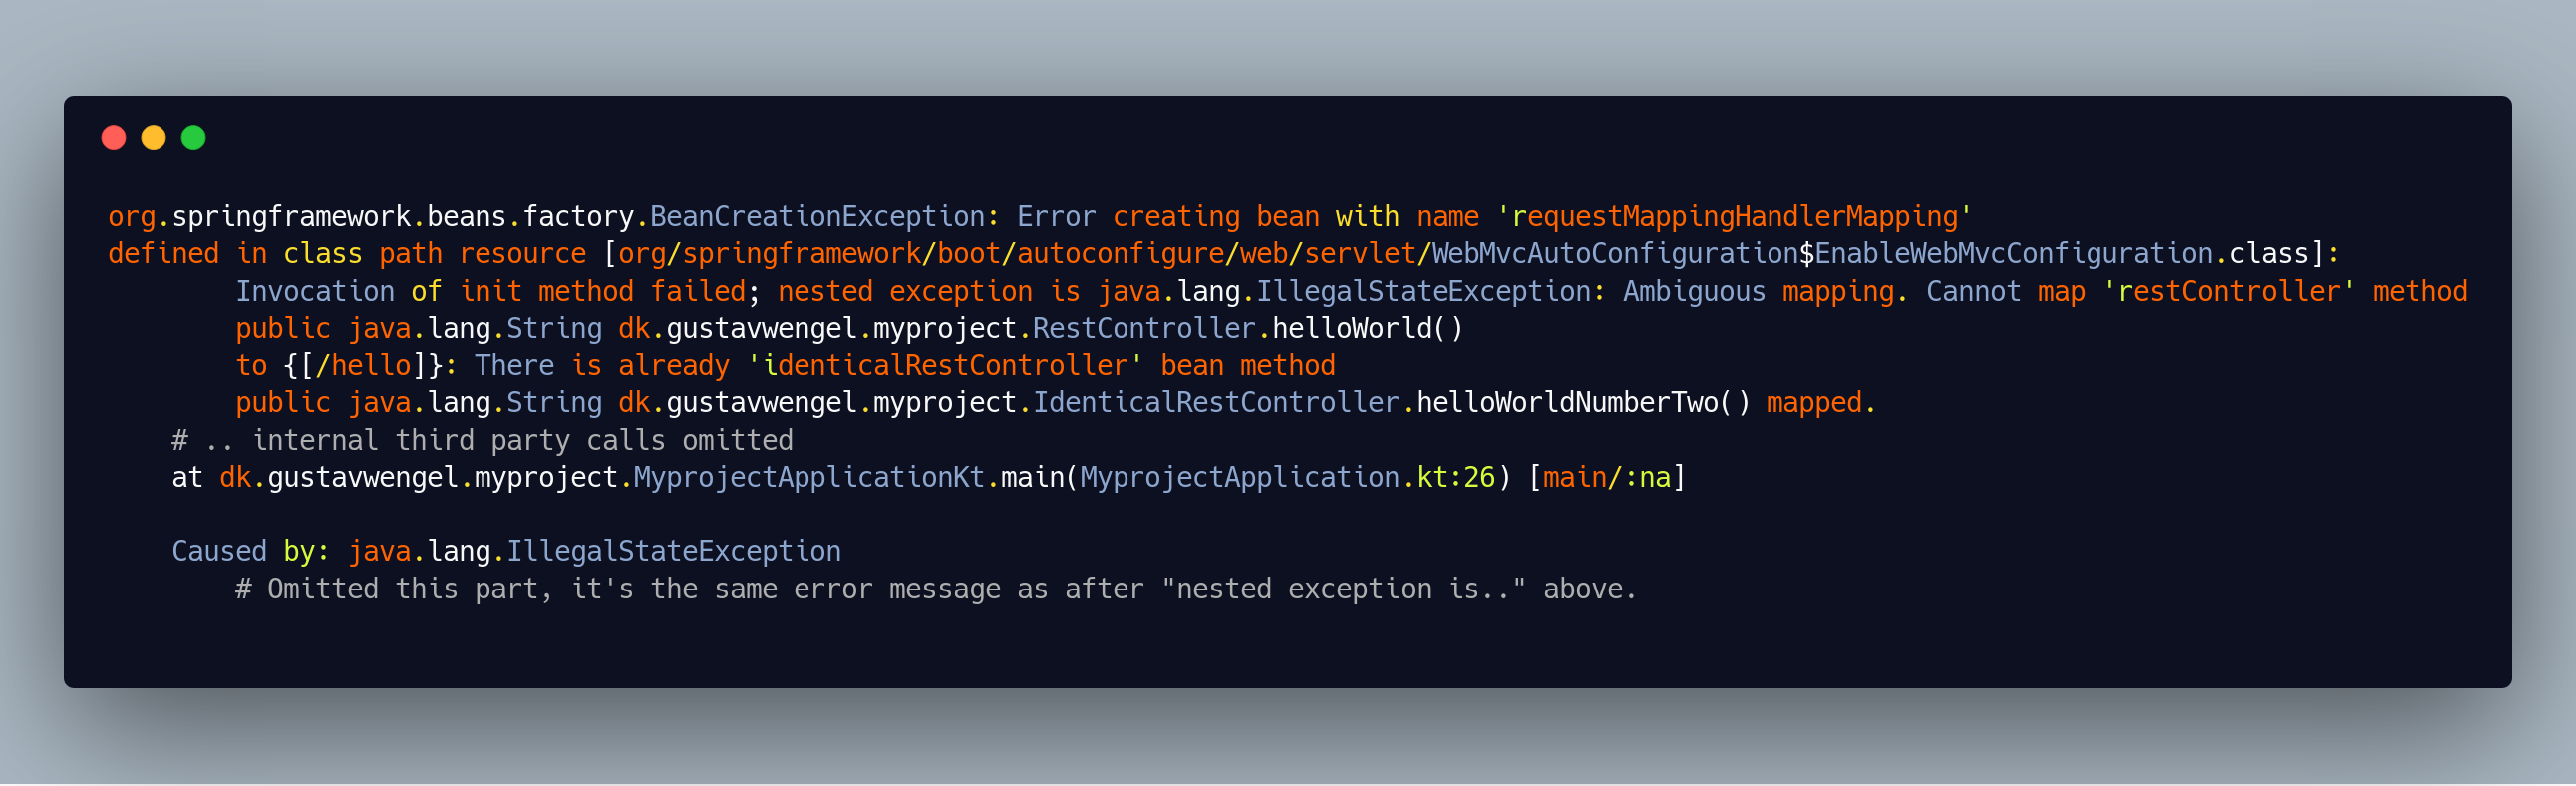
Here it’s easier to find the actual error message, which is luckily reasonably informative:
Ambiguous mapping. Cannot map 'restController' method
public java.lang.String dk.gustavwengel.myproject.RestController.helloWorld()
to {[/hello]}: There is already 'identicalRestController' bean method
If you’re using a large framework it happens quite a bit that there’s no code of yours in the stack trace at all. This usually means it’s a configuration issue, but these errors can be extremely hard to debug. Often we rely on helpful images from the framework authors to get us through these kind of errors, as the stack-trace is close to useless.
Summary
We’ve seen how we can take an error message and divide it into different parts. We’ve discussed what parts are important, and what parts can usually be ignored. In the next part we’ll talk about how to select the right terms when searching, and how googling error messages is actually a process where you learn as you go, not just one where you find answers.
Are you excited for the next part? Did you have any thoughts on this one, or do you just want to gush about how that Elm error message was really great? Reach out to me on twitter at @GeeWengel
Did you enjoy this post? Please share it!
I'm Gustav (Mastodon), I'm currently a Staff Engineer at Climatiq, where we provide an API for all sorts of carbon emission accounting. I currently work mostly with Rust, but I've worked extensively with C#, Node, React, React Native, Typescript and Django.
All content on this website is written by a human. See the AI policy.
See an error? Submit a Pull Request and help fix it!
Back to the front page?